Sunday, July 24, 2005
Earthquake graphic
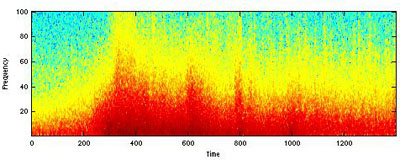
Frequency spectrogram of T wave showing relative strength of different frequencies through time
Posted by Picasa
![]()
Subscribe to Posts [Atom]
Climate change, weather, clouds and other stuff.
![]()
Subscribe to Posts [Atom]